 Dendrita
Free quadrant chart maker
Place bubbles between two axes and edit each circle's position and size.
Open free editor ↗Free charts · PNG and SVG · No sign-up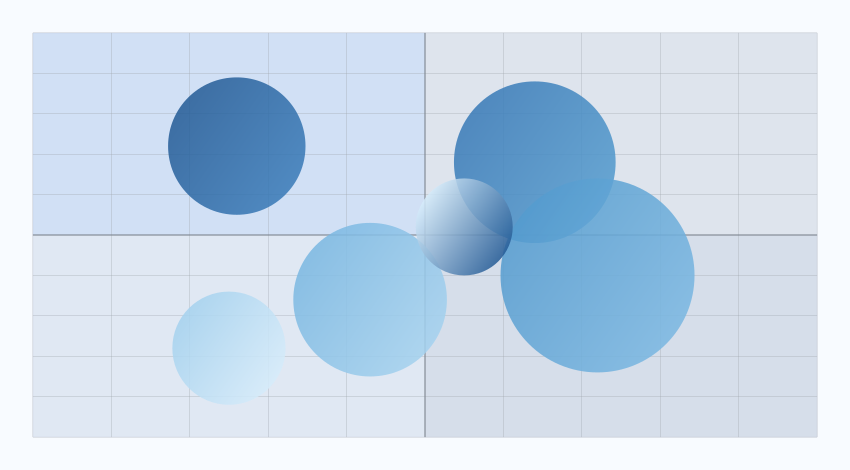
When to use this chart
Organize priorities or position ideas between exploration and application.
How to customize it
Drag bubbles, edit coordinates and radii, label axes and customize quadrant colors.
How to create your chart
Choose a template
Open the editor with its sample and replace titles and values with your own.
Customize the design
Select items with the mouse. Change colors, gradients, fonts and the output frame.
Save or export
Resume your project in this browser’s library or download PNG and SVG.
An example you can edit
| Example item | Value or samples |
|---|---|
| Intuition | x: 26 · y: 72 |
| Prototype | x: 64 · y: 68 |
| Encounter | x: 72 · y: 40 |
| Method | x: 43 · y: 34 |
Frequently asked questions
Can I create charts for free without signing up?
Yes. All 36 makers work without an account or subscription. PNG and SVG exports do not add watermarks.
How can I keep editing my chart in Figma?
Download SVG to preserve vector shapes and colors. PNG is an image for sharing or inserting; it does not let you edit each shape separately.
Where are my projects saved?
Your library and history are saved in the browser you are using. They do not sync across devices. Use Download library and Import backup to move them.