





CREATE, CUSTOMIZE AND EXPORT

Free online
chart maker.

Mind maps, diagrams and 36 types of visualizations.
No sign-up. Download PNG or SVG to keep editing in Figma.

36 creators · PNG & SVG · Editable in Figma
Your next visualization 36
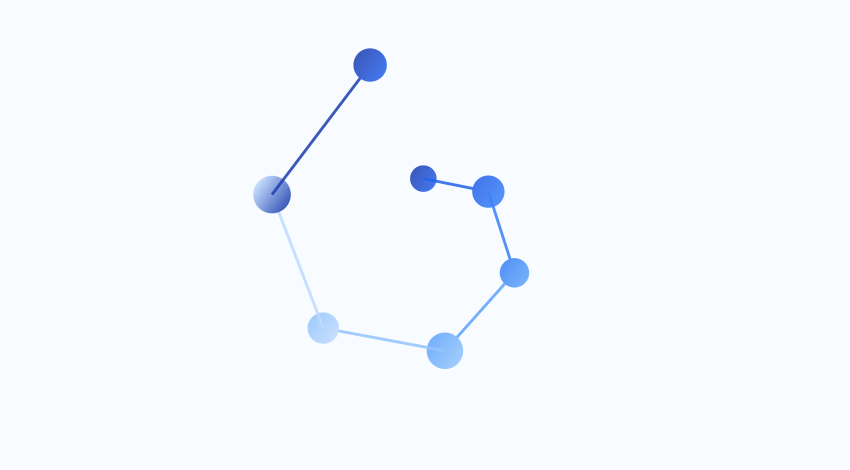
STUDIO 01Organic connections
Relationships

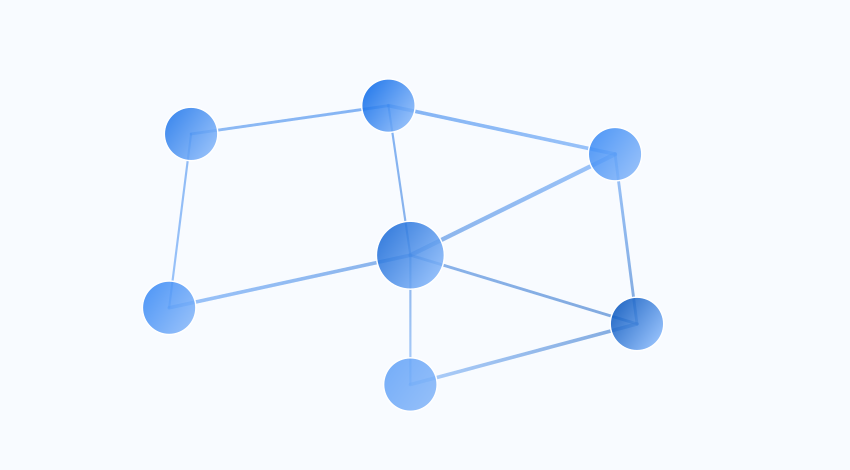
Organic connections

↗

Connect ideas with shapes that flow as you move their nodes.

STUDIO 02Density landscapes
Distributions

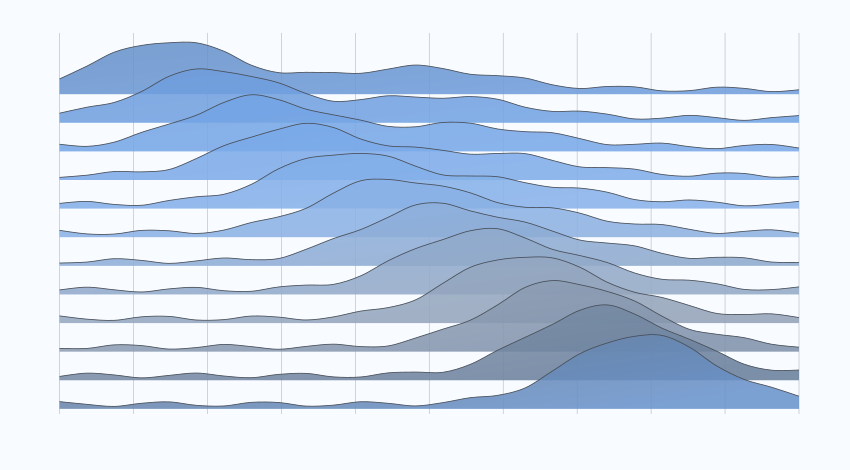
Density landscapes

↗

Compare distributions as a landscape of ridges.

STUDIO 03Radial cycles
Time

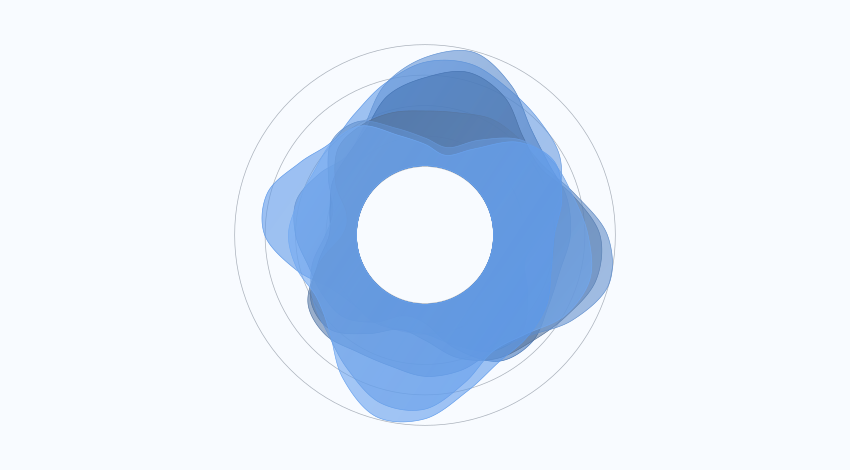
Radial cycles

↗

Overlay rhythms and explore how they vary throughout a cycle.

STUDIO 04Quadrant map
Relationships

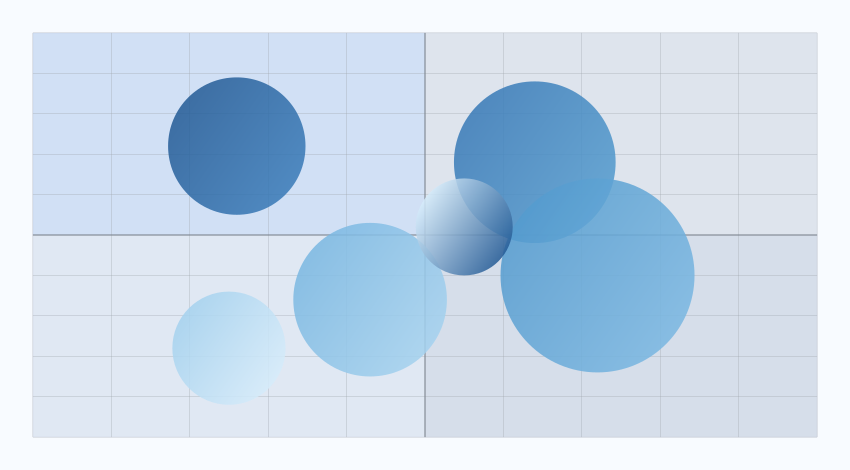
Quadrant map

↗

Place concepts between two axes and discover connections.

STUDIO 05Relationship map
Relationships

Relationship map

↗

Connect people, concepts or teams and show the strength of their relationships.

STUDIO 06Concentric layers
Sequences

Concentric layers

↗

Organize stages in layers with outward callouts.

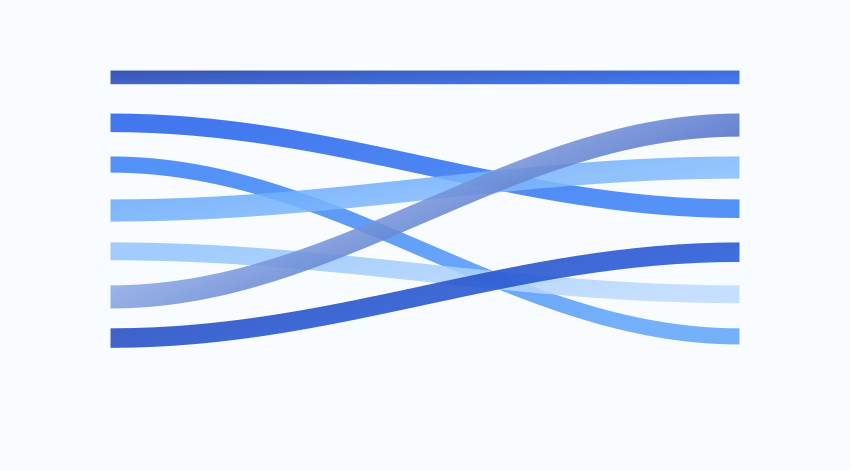
STUDIO 07Color flows
Flows

Color flows

↗

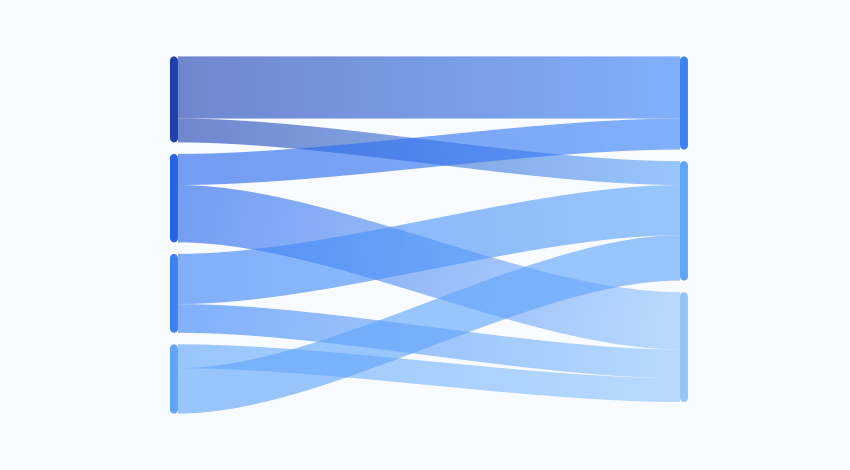
Follow your data from source to destination.

STUDIO 08Circular chords
Relationships

Circular chords

↗

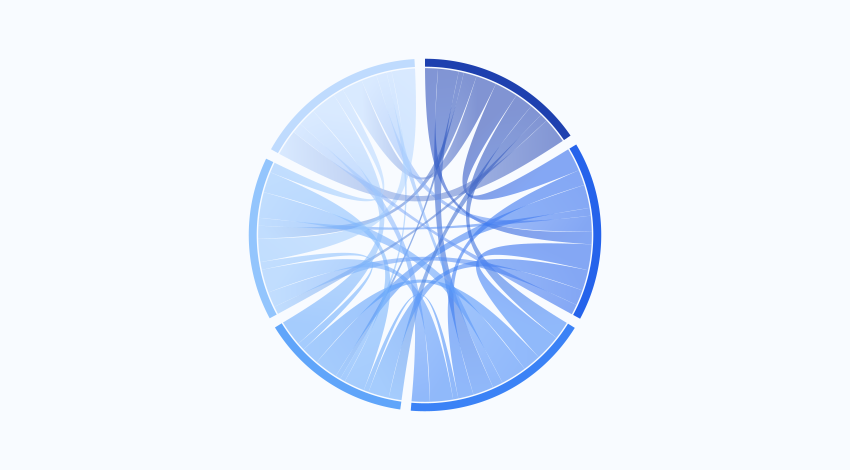
Weave relationships into a wheel of colorful ribbons.

STUDIO 09Data streams
Flows

Data streams

↗

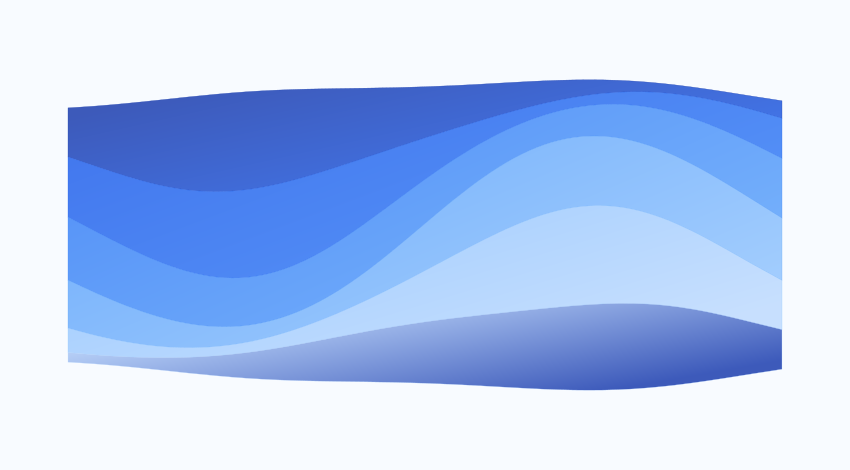
Turn your series into streams that grow and merge.

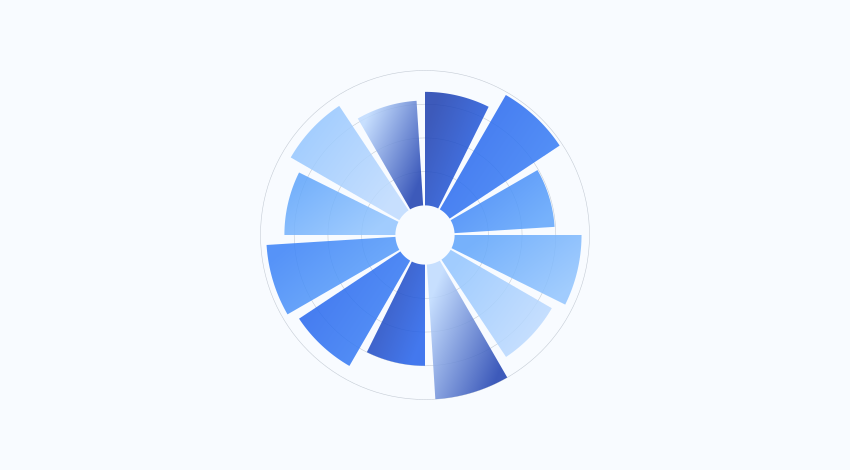
STUDIO 10Radial garden
Comparison

Radial garden

↗

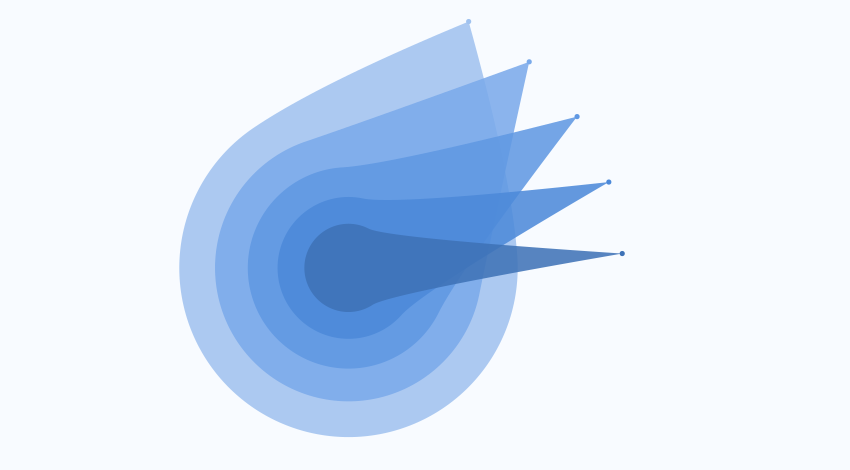
Compare values using petals that open around a center.

STUDIO 11Archipelago
Comparison

Archipelago

↗

Show proportions through a landscape of clustered bubbles.

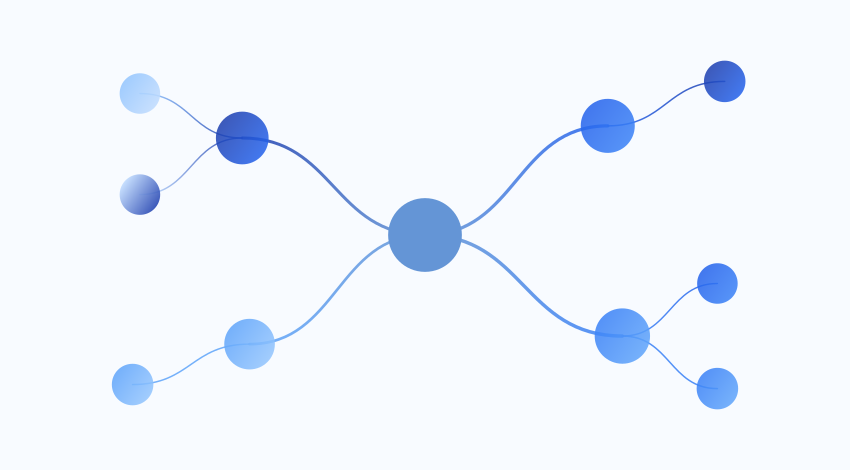
STUDIO 12Mind map
Relationships

Mind map

↗

Branch a concept into connected ideas and rearrange them by hand.

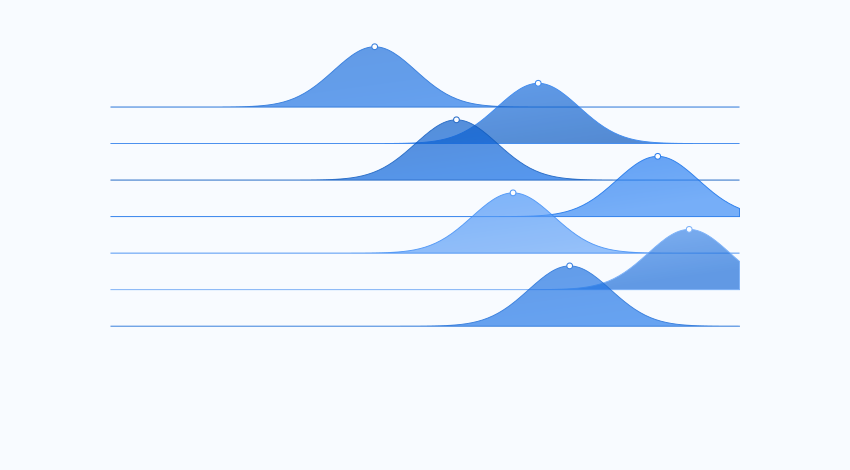
STUDIO 13Sliding mountains
Distributions

Sliding mountains

↗

Drag each peak horizontally to compare values from 0 to 100.

STUDIO 14Alluvial flows
Flows

Alluvial flows

↗

Edit values, select shapes and compose your own visualization.

STUDIO 15Relationship arcs
Flows

Relationship arcs

↗

Edit values, select shapes and compose your own visualization.

STUDIO 16Braided flows
Flows

Braided flows

↗

Edit values, select shapes and compose your own visualization.

STUDIO 17Histogram
Distributions

Histogram

↗

Edit values, select shapes and compose your own visualization.

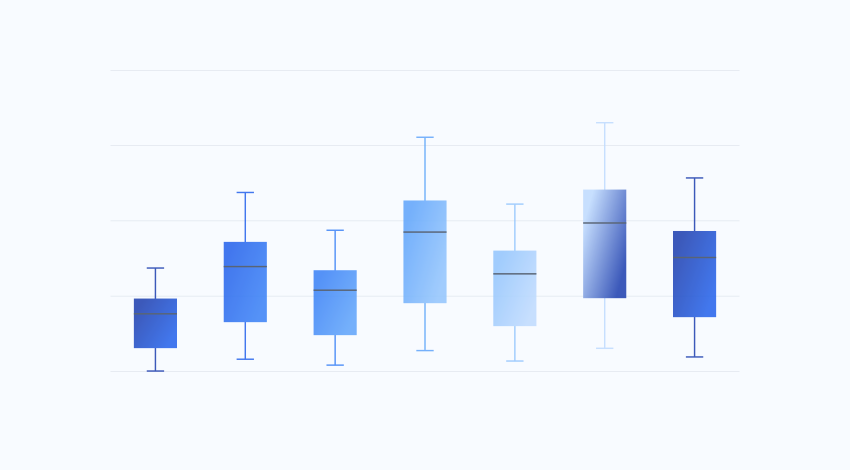
STUDIO 18Box plot
Distributions

Box plot

↗

Edit values, select shapes and compose your own visualization.

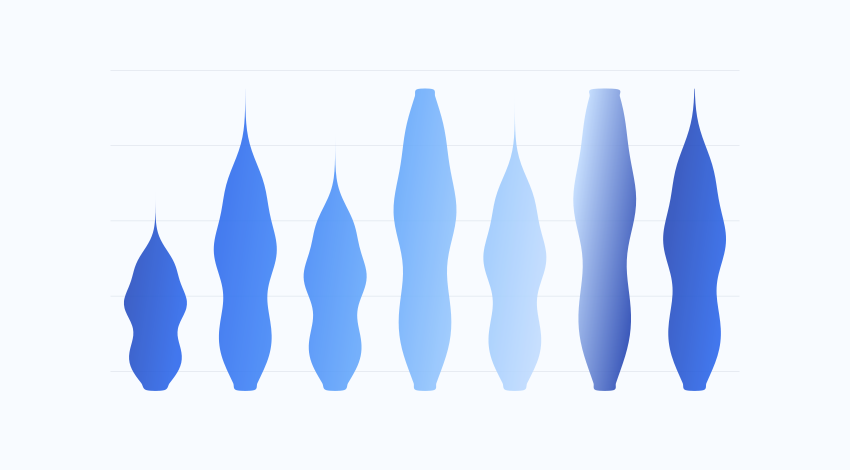
STUDIO 19Density violins
Distributions

Density violins

↗

Edit values, select shapes and compose your own visualization.

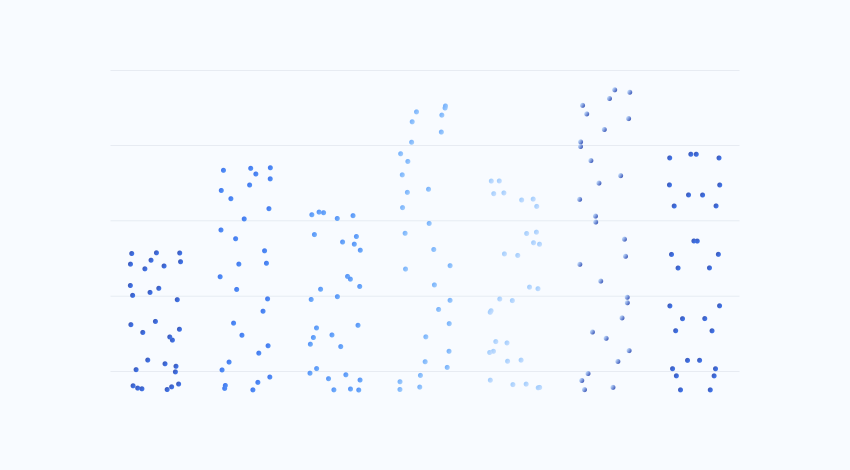
STUDIO 20Beeswarm
Distributions

Beeswarm

↗

Edit values, select shapes and compose your own visualization.

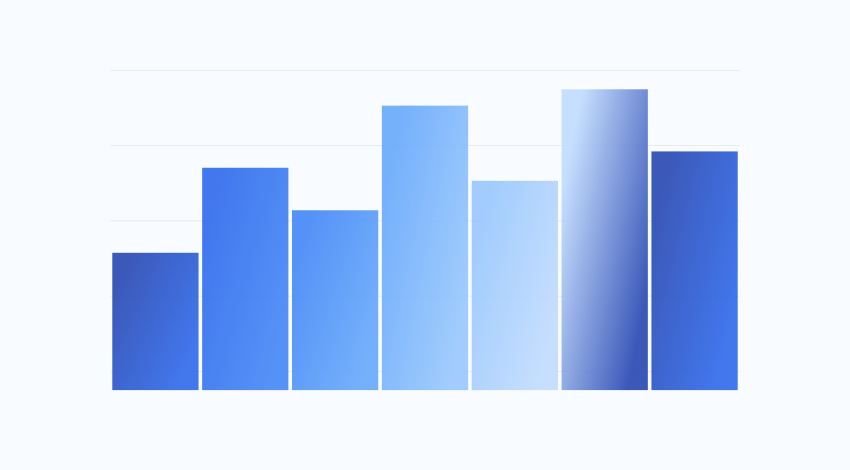
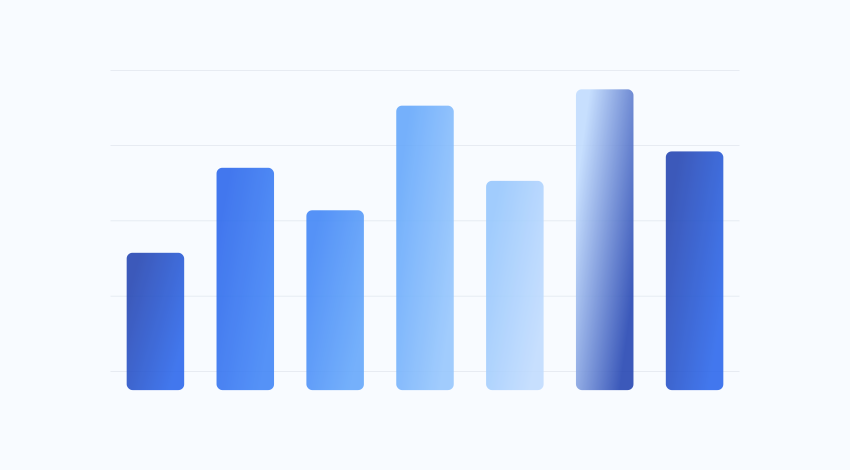
STUDIO 21Gradient bars
Comparison

Gradient bars

↗

Edit values, select shapes and compose your own visualization.

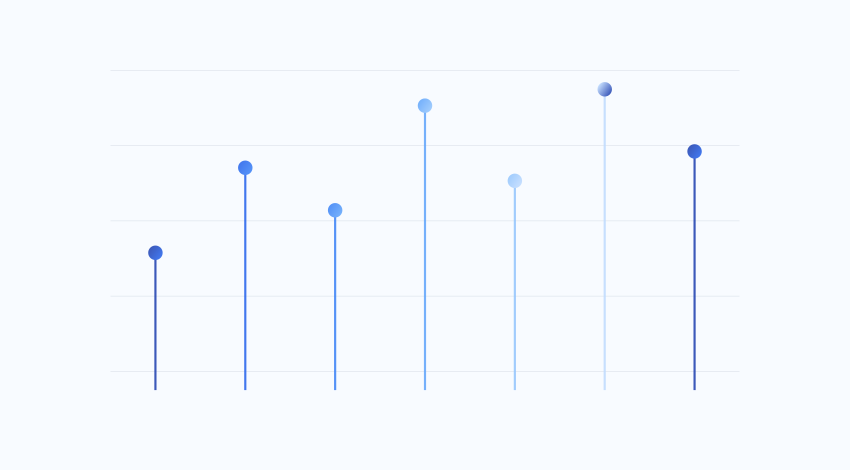
STUDIO 22Lollipop chart
Comparison

Lollipop chart

↗

Edit values, select shapes and compose your own visualization.

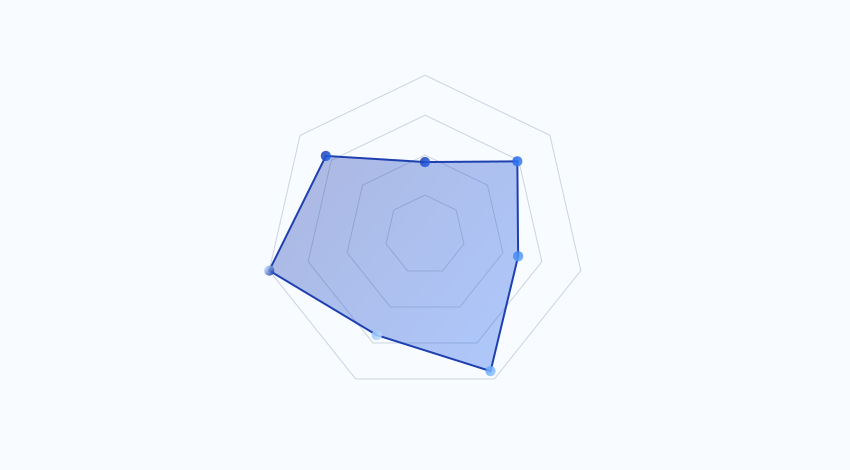
STUDIO 23Profile radar
Comparison

Profile radar

↗

Edit values, select shapes and compose your own visualization.

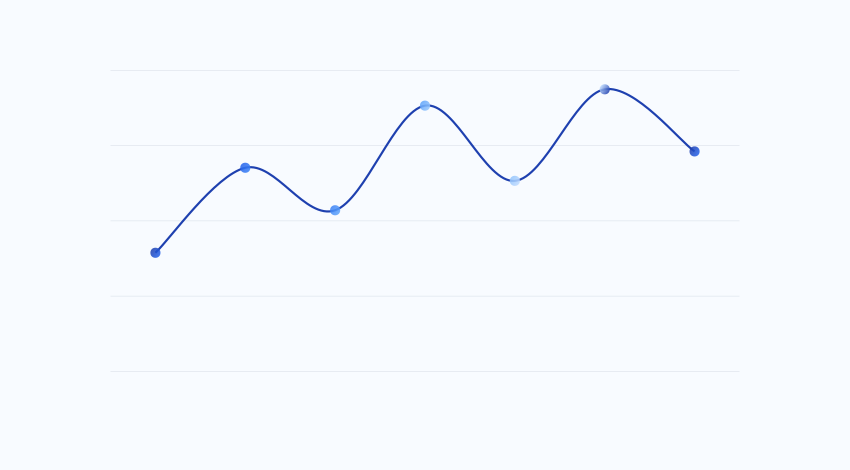
STUDIO 24Time series
Time

Time series

↗

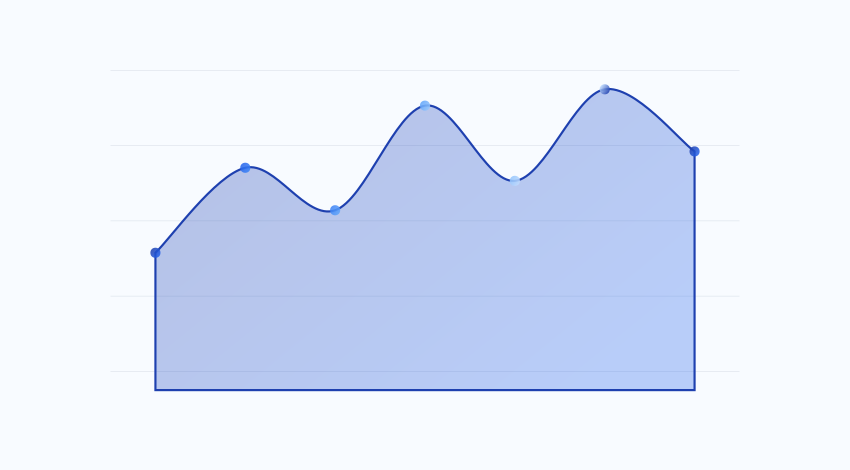
Edit values, select shapes and compose your own visualization.

STUDIO 25Time areas
Time

Time areas

↗

Edit values, select shapes and compose your own visualization.

STUDIO 26Heatmap calendar
Time

Heatmap calendar

↗

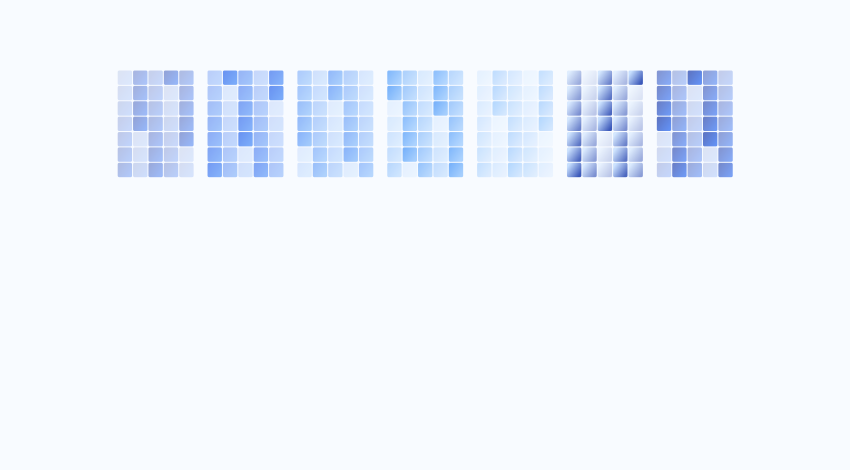
Edit values, select shapes and compose your own visualization.

STUDIO 27Horizon bands
Time

Horizon bands

↗

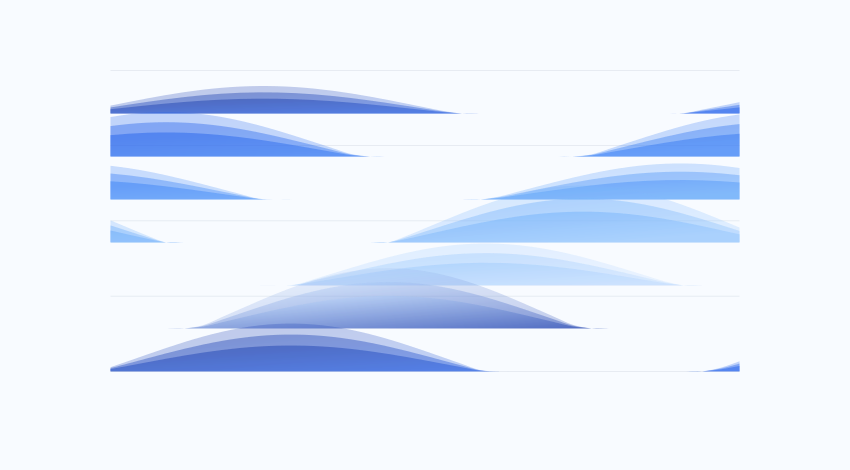
Edit values, select shapes and compose your own visualization.

STUDIO 28Waterfall
Sequences

Waterfall

↗

Edit values, select shapes and compose your own visualization.

STUDIO 29Funnel
Sequences

Funnel

↗

Edit values, select shapes and compose your own visualization.

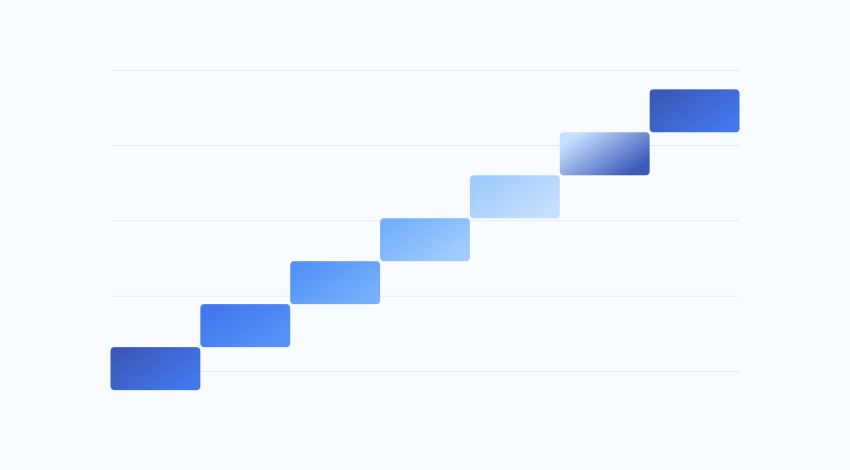
STUDIO 30Step chart
Sequences

Step chart

↗

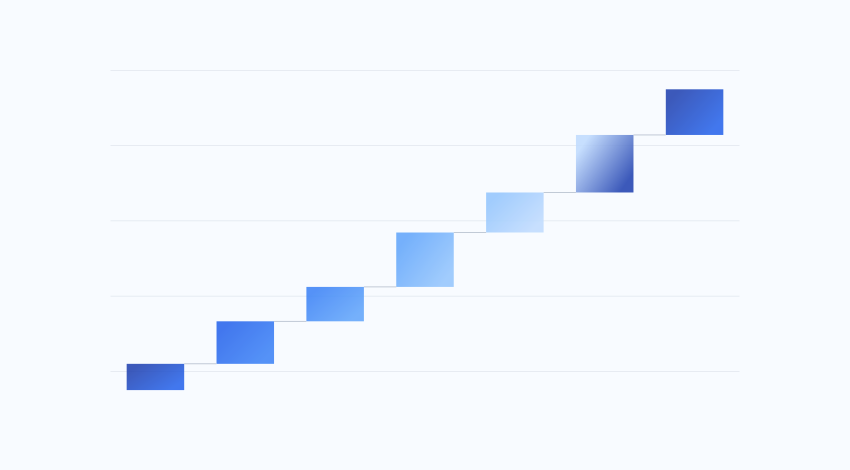
Edit values, select shapes and compose your own visualization.

STUDIO 31Spiral stages
Sequences

Spiral stages

↗

Edit values, select shapes and compose your own visualization.

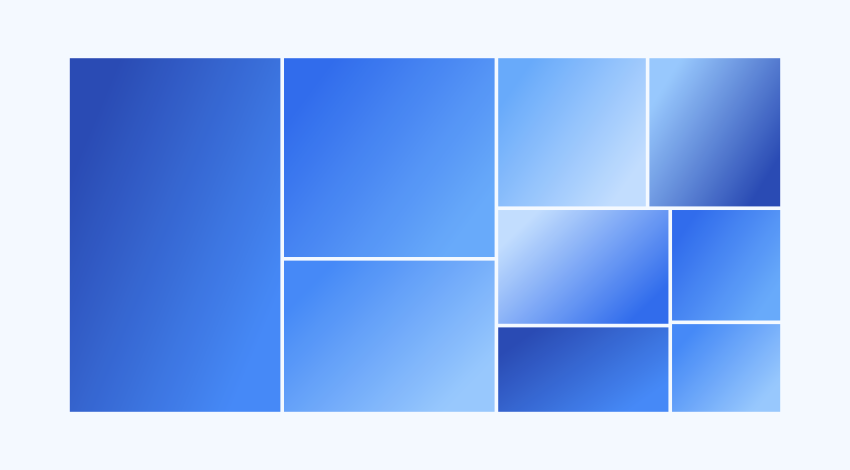
STUDIO 32Treemap
Comparison

Treemap

↗

Divide a total into rectangles whose areas represent each value.

STUDIO 33Percentage cards
Comparison

Percentage cards

↗

Create an editorial dashboard with large figures, titles and descriptions.

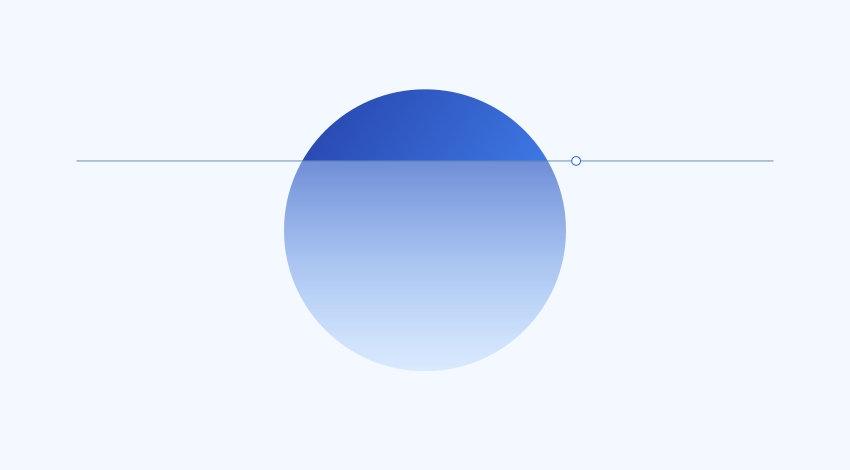
STUDIO 34Proportion iceberg
Distributions

Proportion iceberg

↗

Compare the visible and submerged parts. Drag the line to change their proportions.

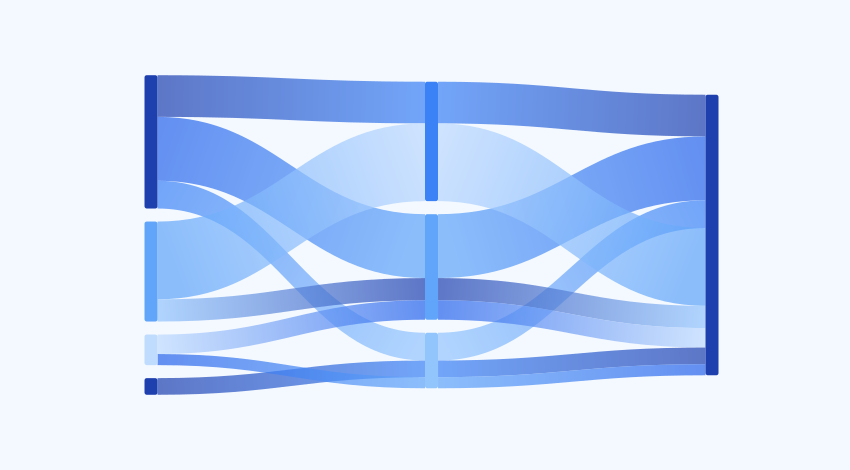
STUDIO 35Multi-stage Sankey
Flows

Multi-stage Sankey

↗

Follow each contribution from its source, through a category, to its destination.

STUDIO 36Radial comparison
Comparison

Radial comparison

↗

Compare two series with pairs of circular bars and draggable endpoints.

DENDRITA · PNG & SVG

A chart editor for designing, explaining and sharing

Create mind maps, relationship networks, bar charts, Sankey diagrams and density visualizations in one studio. Start with an editable example and adapt colors and typography to your presentation.

Export for a presentation, a document or Figma

Choose an A4, A3, square or screen frame, or work on an infinite canvas. Download PNG when you need an image and SVG when you want to preserve vectors. Import fonts and adjust bold, italic and text size.

Mouse editing and keyboard shortcuts

Select and move items, use marquee selection and copy or paste with Ctrl+C and Ctrl+V. Ctrl+Z undoes changes and Ctrl+Y redoes them. Each maker adds controls for its own shapes and values.

How to create your chart

  1. Choose a template

    Open the editor with its sample and replace titles and values with your own.

  2. Customize the design

    Select items with the mouse. Change colors, gradients, fonts and the output frame.

  3. Save or export

    Resume your project in this browser’s library or download PNG and SVG.

Frequently asked questions

Can I create charts for free without signing up?

Yes. All 36 makers work without an account or subscription. PNG and SVG exports do not add watermarks.

How can I keep editing my chart in Figma?

Download SVG to preserve vector shapes and colors. PNG is an image for sharing or inserting; it does not let you edit each shape separately.

Where are my projects saved?

Your library and history are saved in the browser you are using. They do not sync across devices. Use Download library and Import backup to move them.

Are my chart data sent to a server?

The editor processes chart content in your browser. There are no user accounts or project-sync service. Cloudflare serves the website and its files.

Does this tool perform statistical analysis?

Dendrita is a visual editor. Some models draw numerical samples and others are illustrative compositions. Each chart guide explains what its model represents and its limitations.

Artboard
100%